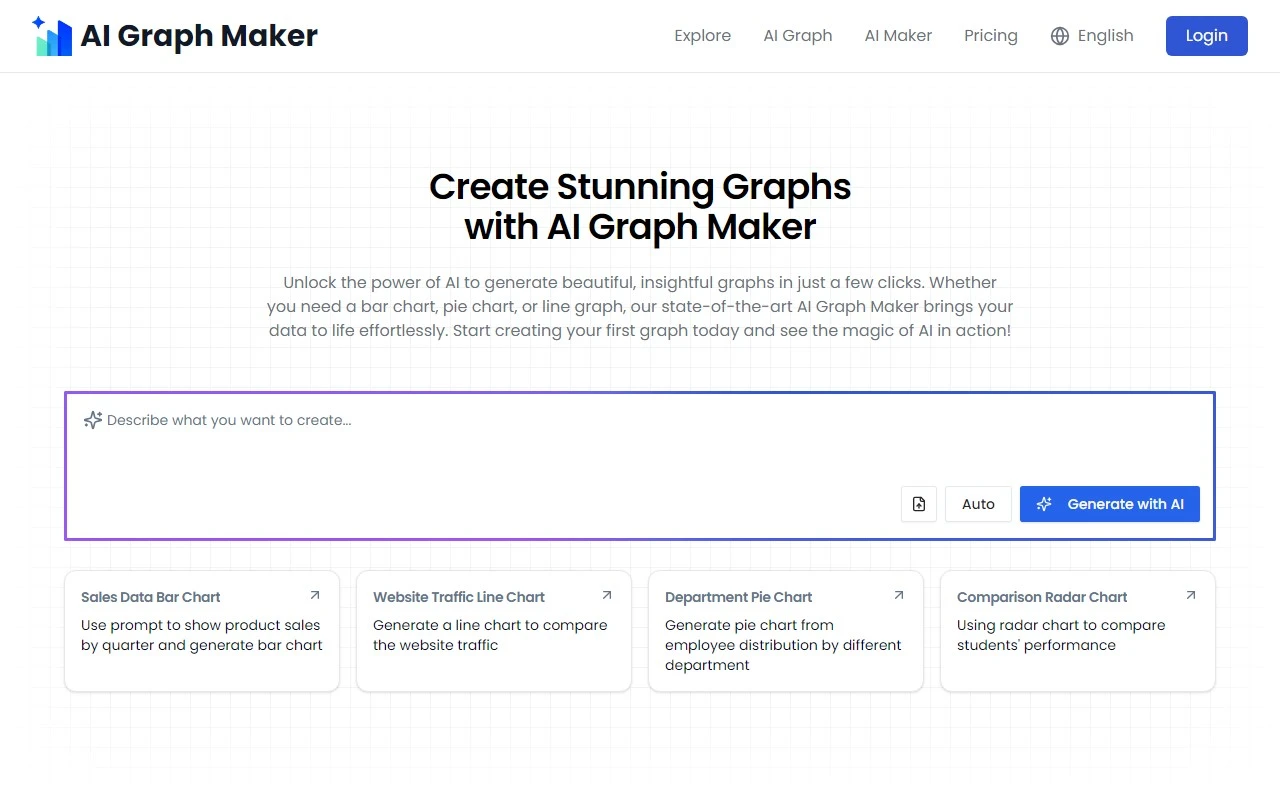
AI Graph Maker: Your AI-Powered Data Visualization Sidekick
If you’ve ever struggled to turn raw data into something visually stunning, AI Graph Maker is here to save the day. This AI-powered tool is designed to make data visualization effortless, whether you’re a seasoned analyst or someone who just needs to create a quick chart for a presentation. With its intuitive interface and robust features, AI Graph Maker transforms complex data into beautiful, easy-to-understand graphs and charts in minutes.
What Makes AI Graph Maker Stand Out?
At its core, AI Graph Maker is all about simplicity and versatility. It supports a wide range of chart types, including bar charts, pie charts, line charts, and more. But what really sets it apart is its AI-driven approach. Instead of spending hours tweaking settings, you can let the tool do the heavy lifting. Just input your data, choose your preferred graph type, and let the AI work its magic.
Key features include:
- AI-driven chart generation: Automatically creates polished graphs with minimal input.
- Multiple graph types: From bar charts to mind maps, it’s got you covered.
- Customizable styles: Tailor colors, labels, and layouts to match your brand or presentation theme.
- Multi-format exports: Download your graphs as PNG, SVG, or PDF for seamless sharing.
How to Use AI Graph Maker: A Quick Walkthrough
Using AI Graph Maker is as easy as 1-2-3:
- Input your data: Paste your dataset or upload a file.
- Choose your graph type: Select from options like bar, pie, or line charts.
- Generate and customize: Click ‘Generate with AI,’ tweak the design if needed, and download or share your masterpiece.
For example, imagine you’re analyzing your company’s quarterly sales performance. Instead of manually creating a bar chart in Excel, you can upload your sales data to AI Graph Maker, select a bar chart, and have a professional-looking visualization ready in seconds.
Real-World Use Cases
AI Graph Maker isn’t just for data analysts—it’s for anyone who needs to visualize information. Here are a few ways it can help:
- Sales teams: Create bar charts to track quarterly performance or visualize year-over-year growth.
- Project managers: Generate timelines to keep your team on track and stakeholders informed.
- Creative professionals: Design mind maps for brainstorming sessions or concept development.
Frequently Asked Questions
How do I create graphs using AI Graph Maker?
Simply input your data, select your graph type, and let the AI generate it for you. You can then customize and export it.
Can I customize the style and content of my graphs?
Absolutely! AI Graph Maker allows you to adjust colors, labels, and layouts to suit your needs.
What export options are available?
You can download your graphs as PNG, SVG, or PDF files.
How do I contact support?
For technical assistance, email [email protected]. They’re quick to respond and ready to help.
Get Started with AI Graph Maker
Ready to give it a try? Head over to the AI Graph Maker login page to create your account. For developers or those interested in exploring the tool’s codebase, check out their GitHub repository.
Whether you’re a data pro or a beginner, AI Graph Maker is a game-changer for anyone looking to simplify data visualization. Give it a spin and see how it can transform your workflow!
