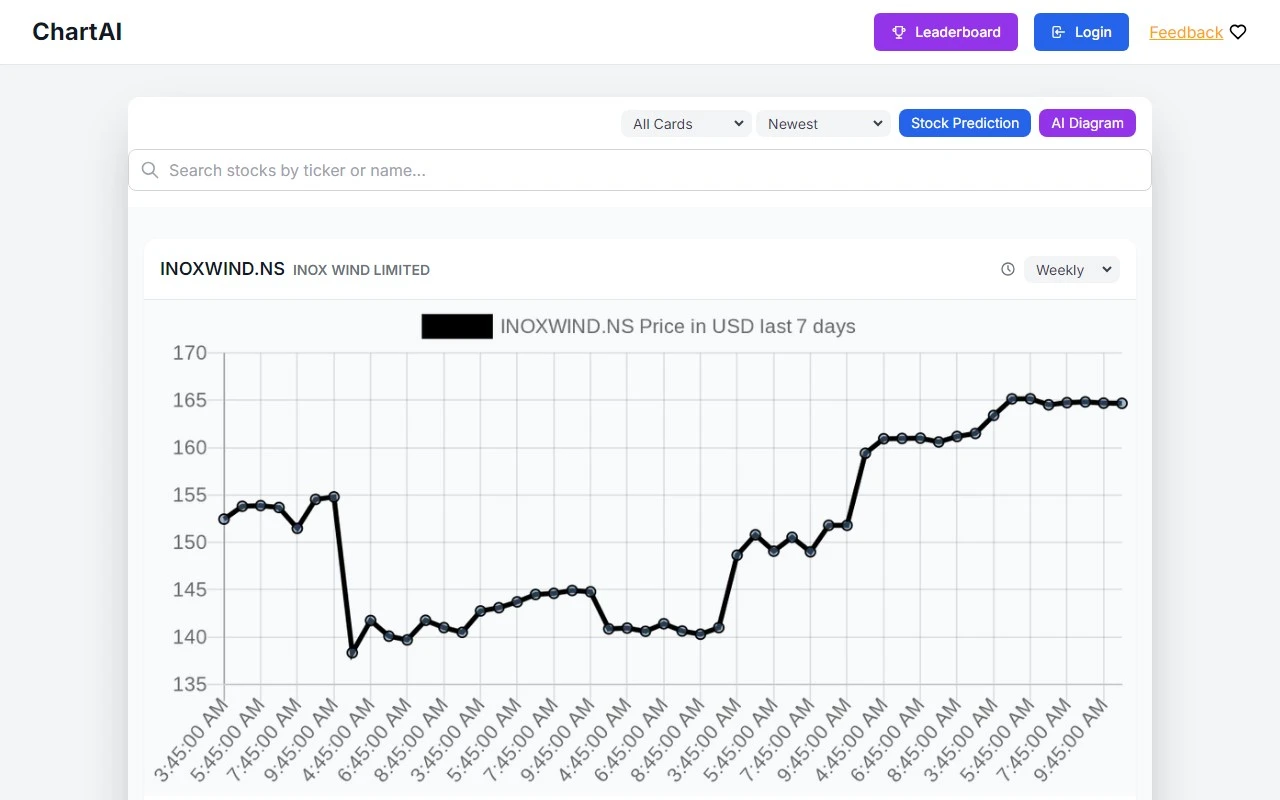
ChartAI: Revolutionizing Data Visualization with AI-Powered Insights
If you’ve ever struggled to turn raw data into meaningful visuals, ChartAI is here to change the game. Powered by ChatGPT, this innovative platform simplifies the process of creating and understanding charts and diagrams, making it accessible to everyone—whether you’re a business professional, researcher, or student.
What is ChartAI?
ChartAI is a cutting-edge tool that leverages ChatGPT technology to help users transform data into clear, impactful visualizations. Whether you’re looking to create a bar chart, pie chart, or complex diagram, ChartAI does the heavy lifting for you. But it doesn’t stop there—it also provides insights and explanations to help you understand the story behind the data.
How Does ChartAI Work?
Using ChartAI is as simple as it gets. Just head over to their website, input your data, and let ChatGPT guide you. You can ask specific questions like, “How do I visualize sales trends over the past year?” or “What’s the best way to compare market share across competitors?” ChartAI will generate the chart or diagram you need, and you can even use its interactive tools to customize and refine the visualization to your liking.
Core Features That Set ChartAI Apart
- Versatile Chart Generation: Create a wide range of charts and diagrams, from simple bar graphs to intricate flowcharts.
- AI-Powered Insights: Get explanations and interpretations of your data, making it easier to draw meaningful conclusions.
- Customization Tools: Tailor your visualizations with colors, labels, and other design elements to suit your needs.
- Interactive Experience: Manipulate and explore your data in real-time for a deeper understanding.
Real-World Use Cases
ChartAI isn’t just a tool—it’s a solution for a variety of scenarios:
- Business Presentations: Impress stakeholders with polished, data-driven visuals that tell a compelling story.
- Academic Research: Simplify complex data into digestible charts for papers or presentations.
- Data Analysis: Quickly identify trends and patterns without getting bogged down in spreadsheets.
- Education: Teach students the art of data visualization in an engaging, interactive way.
Frequently Asked Questions
- What types of charts and diagrams can ChartAI generate?
ChartAI supports a wide range of visuals, including bar charts, pie charts, line graphs, flowcharts, and more. - Can ChartAI analyze my data and provide insights?
Absolutely! ChartAI not only creates visuals but also offers insights to help you understand your data better. - Is it possible to customize the visualizations?
Yes, you can tweak colors, labels, and other elements to match your preferences. - Can I use ChartAI for educational purposes?
Definitely! ChartAI is a fantastic tool for teaching and learning data visualization.
Connect with ChartAI
- Discord Community: Join the conversation on their Discord server to share tips, ask questions, and connect with other users.
- Support Email: Need help? Reach out to their customer service team at [email protected].
- YouTube Channel: Check out tutorials and demos on their YouTube channel.
About ChartAI
ChartAI is developed by AHILAB, a company dedicated to creating innovative tools that simplify complex tasks. Ready to get started? Head over to their login page and unlock the power of AI-driven data visualization.
Whether you’re a data novice or a seasoned analyst, ChartAI is the tool you’ve been waiting for. Give it a try and see how it can transform the way you work with data!
