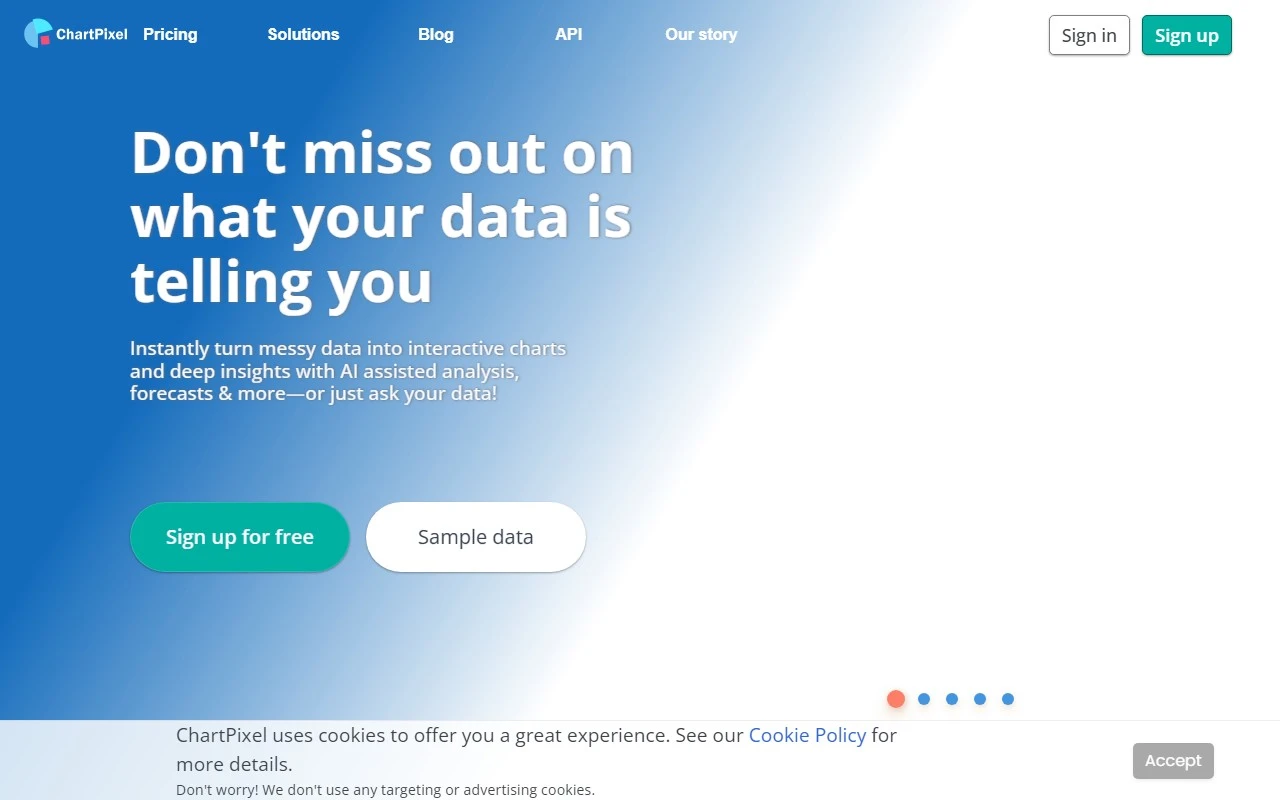
ChartPixel: Your AI-Powered Data Visualization Sidekick
If you’ve ever stared at a spreadsheet full of raw data and felt overwhelmed, ChartPixel is here to save the day. This AI-driven platform is designed to simplify data analysis, making it accessible to everyone—whether you’re a seasoned data scientist or a complete beginner. Let’s dive into what makes ChartPixel a game-changer in the world of data visualization.
What is ChartPixel?
ChartPixel is an AI-assisted data analysis platform that transforms raw data into meaningful insights and stunning visualizations. Think of it as your personal data analyst, but faster and without the need for coding or complex software. Whether you’re working with customer surveys, sales figures, or sports statistics, ChartPixel helps you uncover trends and patterns with ease.
How Does ChartPixel Work?
Using ChartPixel is as simple as 1-2-3:
- Upload your data in formats like CSV, Excel, or JSON.
- Let the platform’s AI work its magic—automatically cleaning, formatting, and analyzing your data.
- Explore the interactive charts and insights generated, complete with easy-to-understand explanations.
For example, imagine you’ve just collected feedback from a customer survey. With ChartPixel, you can quickly visualize responses, identify areas for improvement, and even export the results directly to PowerPoint for a polished presentation.
Key Features That Make ChartPixel Stand Out
Here’s what sets ChartPixel apart from other data visualization tools:
- AI-Assisted Insights: The platform doesn’t just create charts—it explains what the data means, helping you make informed decisions.
- Automated Data Cleaning: No more manual formatting! ChartPixel ensures your data is ready for analysis in seconds.
- Interactive Charts: Customize and explore your visualizations with a few clicks.
- One-Click Export: Seamlessly export your charts to PowerPoint for presentations or reports.
Real-World Use Cases
ChartPixel isn’t just a tool—it’s a solution for a variety of scenarios:
- Customer Surveys: Analyze feedback to improve your products or services.
- Sports Analytics: Visualize player statistics to track performance and strategize effectively.
- Business Reporting: Transform sales or financial data into clear, actionable insights.
Frequently Asked Questions
- What types of data can I upload?
ChartPixel supports CSV, Excel, JSON, and more. - Do I need prior data analysis experience?
Not at all! The platform is designed for users of all skill levels. - How does ChartPixel ensure data security?
Your data is protected with industry-standard encryption and secure storage protocols.
Get Started with ChartPixel
Ready to unlock the power of your data? Here’s how to begin:
- Sign up: Create your account here.
- Log in: Access your dashboard here.
- Explore pricing: Check out the flexible plans on the Pricing Page.
Need Help? We’ve Got You Covered
If you have questions or need assistance, ChartPixel’s support team is just a click away:
- Contact Us: Visit the Contact Page for all inquiries.
- Social Media: Stay updated and connect with the community on Facebook, LinkedIn, and Twitter.
About ChartPixel
ChartPixel is developed by ChartPixel Ltd, headquartered at 128 City Road, EC1V 2NX, London, UK. Learn more about the company and its mission on the About Us Page.
Final Thoughts
ChartPixel is more than just a data visualization tool—it’s a bridge between raw data and actionable insights. Whether you’re a business professional, researcher, or sports enthusiast, this platform empowers you to make data-driven decisions with confidence. Give it a try and see how it can transform the way you work with data!