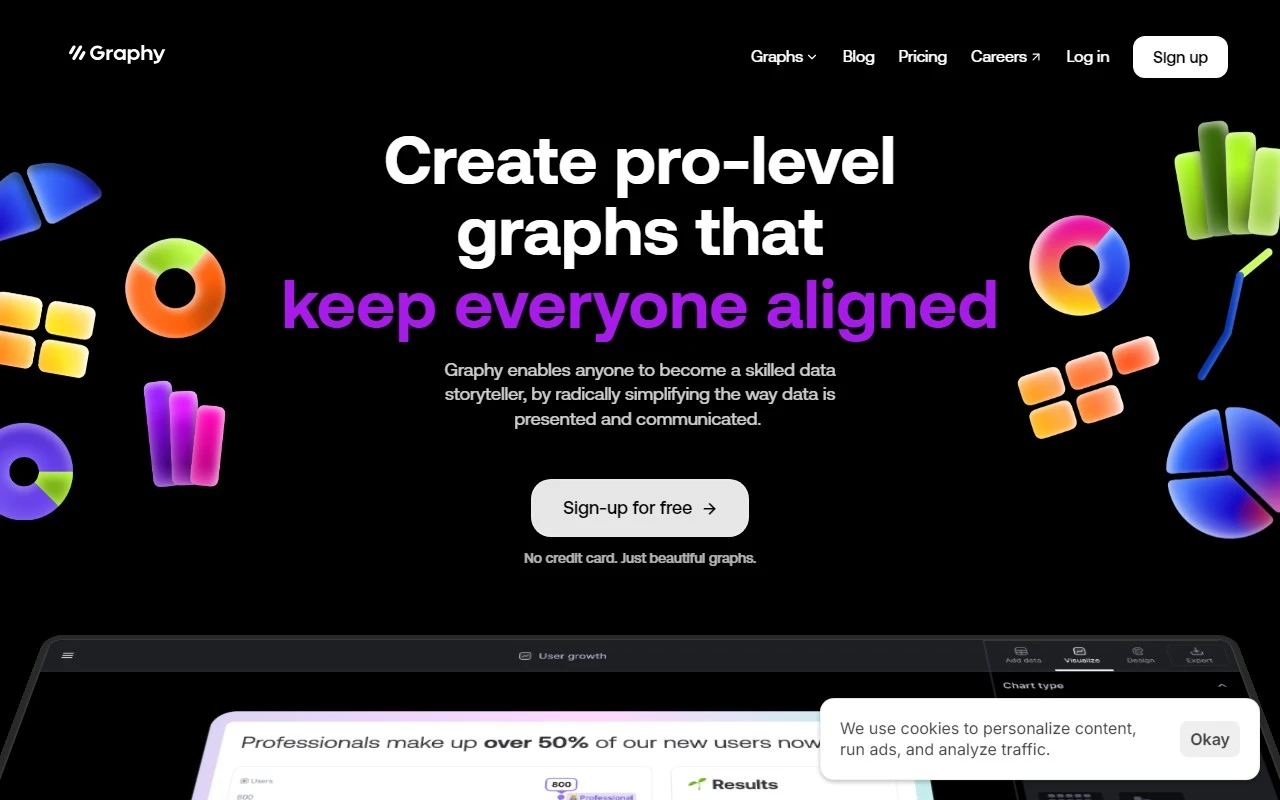
Graphy: The Ultimate Tool for Pro-Level Data Visualization
If you’ve ever struggled to turn raw data into compelling visuals, Graphy is here to save the day. This intuitive data visualization tool empowers users to create professional graphs and charts that not only look stunning but also tell a story. Whether you’re presenting to stakeholders, collaborating with your team, or sharing insights on social media, Graphy makes it easy to communicate data-driven decisions effectively.
What is Graphy?
Graphy is a data visualization powerhouse designed for professionals who want to elevate their data storytelling game. It simplifies the process of creating graphs and charts, so you can focus on what really matters: uncovering insights and making informed decisions. With its sleek interface and robust features, Graphy is perfect for anyone from data analysts to marketers, educators, and beyond.
How to Use Graphy
Getting started with Graphy is a breeze. Here’s how it works:
- Sign up for free: Head over to the Graphy Signup Page to create your account.
- Connect your data sources: Whether it’s a spreadsheet, database, or cloud service, Graphy integrates seamlessly.
- Create your visuals: Use the drag-and-drop interface to design beautiful, actionable graphs in minutes.
Core Features That Make Graphy Stand Out
- Professional Graph Creation: Craft polished, publication-ready charts that impress every time.
- Interactive Data Storytelling: Add interactivity to your graphs, making it easy for viewers to explore the data.
- Easy Data Integration: Connect to popular data sources like Excel, Google Sheets, and more.
- AI-Generated Insights: Let Graphy’s AI analyze your data and suggest key trends and patterns.
Real-World Use Cases for Graphy
Here’s how people are using Graphy to transform their workflows:
- Reports and Presentations: Turn complex data into clear, visually appealing graphs for board meetings or client presentations.
- Team Collaboration: Work in real-time with your team to create and refine visuals, ensuring everyone is on the same page.
- Social Media and Newsletters: Design eye-catching graphs to engage your audience on platforms like Instagram, LinkedIn, or TikTok.
Frequently Asked Questions
-
Is Graphy free to use?
Yes! Graphy offers a free plan to get you started. For advanced features, check out the Graphy Pricing Page. -
What data sources can I connect to Graphy?
Graphy supports a wide range of sources, including Excel, Google Sheets, CSV files, and more.
Stay Connected with Graphy
Graphy isn’t just a tool—it’s a community. Follow them on social media for tips, tutorials, and inspiration:
- YouTube: Graphy YouTube
- TikTok: Graphy TikTok
- LinkedIn: Graphy LinkedIn
- Twitter: Graphy Twitter
- Instagram: Graphy Instagram
Ready to Get Started?
Graphy is more than just a data visualization tool—it’s your partner in turning numbers into narratives. Sign up today at the Graphy Signup Page and see how easy it is to create pro-level graphs that drive decisions and inspire action.
Your data deserves to be seen. Let Graphy help you tell its story.
