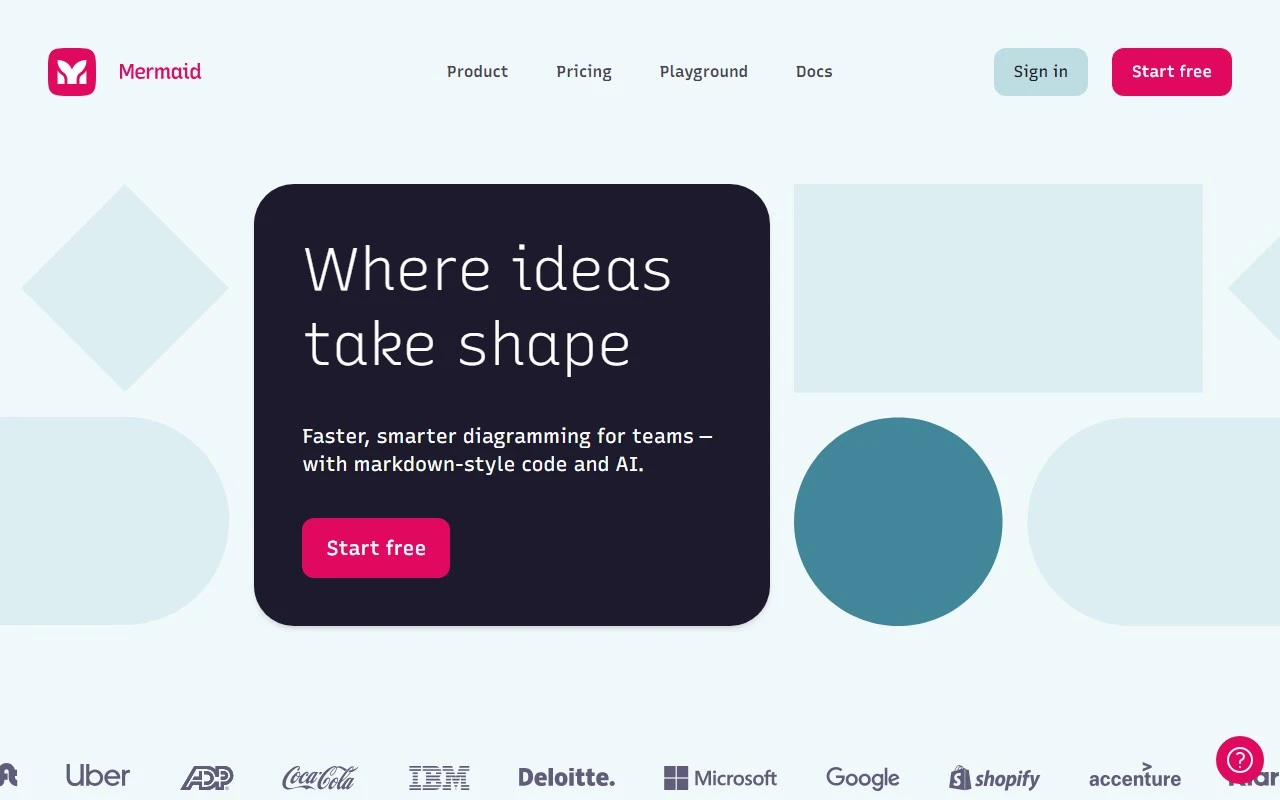
Mermaid Chart: A Collaborative Diagramming Powerhouse
If you’ve ever struggled to visually communicate complex ideas or streamline team workflows, Mermaid Chart might just be your new best friend. Built on the foundation of the popular Mermaid open-source project (boasting an impressive 61k GitHub stars), this platform takes text-based diagramming to the next level with AI-powered visualizations and seamless collaboration.
What Makes Mermaid Chart Stand Out?
At its core, Mermaid Chart is all about simplicity and efficiency. Instead of wrestling with clunky drag-and-drop tools, you can create stunning diagrams using a text-based format. Think of it as writing code for your visuals—once you type it out, the platform instantly converts your text into professional-grade diagrams in real-time.
But that’s not all. Mermaid Chart is designed to enhance team collaboration, making it a go-to tool for software developers, system architects, and business analysts alike. Whether you’re documenting code, mapping out system architectures, or modeling business processes, this platform has you covered.
Key Features at a Glance
- Collaborative Diagramming: Work seamlessly with your team in real-time.
- Text-Based Format: Write diagrams as code—no design skills required.
- AI-Powered Visualization: Let AI handle the heavy lifting to create clear, impactful visuals.
- Code Documentation: Perfect for developers who want to keep their documentation clean and up-to-date.
- Enhanced Team Workflows: Streamline communication and reduce misunderstandings.
Real-World Use Cases
Here’s where Mermaid Chart truly shines. It’s not just a tool—it’s a solution for a variety of challenges:
- Software Development: Visualize code flows and architecture to keep your team aligned.
- System Architecture Design: Map out complex systems with ease.
- Business Process Modeling: Simplify workflows and identify bottlenecks.
- Data Flow Diagrams: Clearly illustrate how data moves through your systems.
- Network Infrastructure Planning: Design and document network layouts efficiently.
Getting Started
Ready to dive in? Getting started is a breeze. Simply sign up at Mermaid Chart Sign Up or log in if you already have an account at Mermaid Chart Login.
Pricing That Fits Your Needs
Mermaid Chart offers flexible pricing plans to suit individuals, teams, and enterprises. Check out the details on the Mermaid Chart Pricing page to find the perfect fit for your needs.
Support and Community
Need help? The Mermaid Chart community is here for you. Join the conversation on Discord at Mermaid Chart Discord or reach out to the support team via the Contact Us page.
Connect with Mermaid Chart
Stay updated with the latest news and updates by following Mermaid Chart on:
- LinkedIn: Mermaid Chart LinkedIn
- Twitter: Mermaid Chart Twitter
- GitHub: Mermaid Chart GitHub
Why Mermaid Chart?
In a world where clarity and collaboration are key, Mermaid Chart stands out as a tool that’s both powerful and approachable. Whether you’re a seasoned developer or a business professional, it’s designed to make your life easier—one diagram at a time.
So, what are you waiting for? Explore the platform, join the community, and see how Mermaid Chart can transform the way you work.