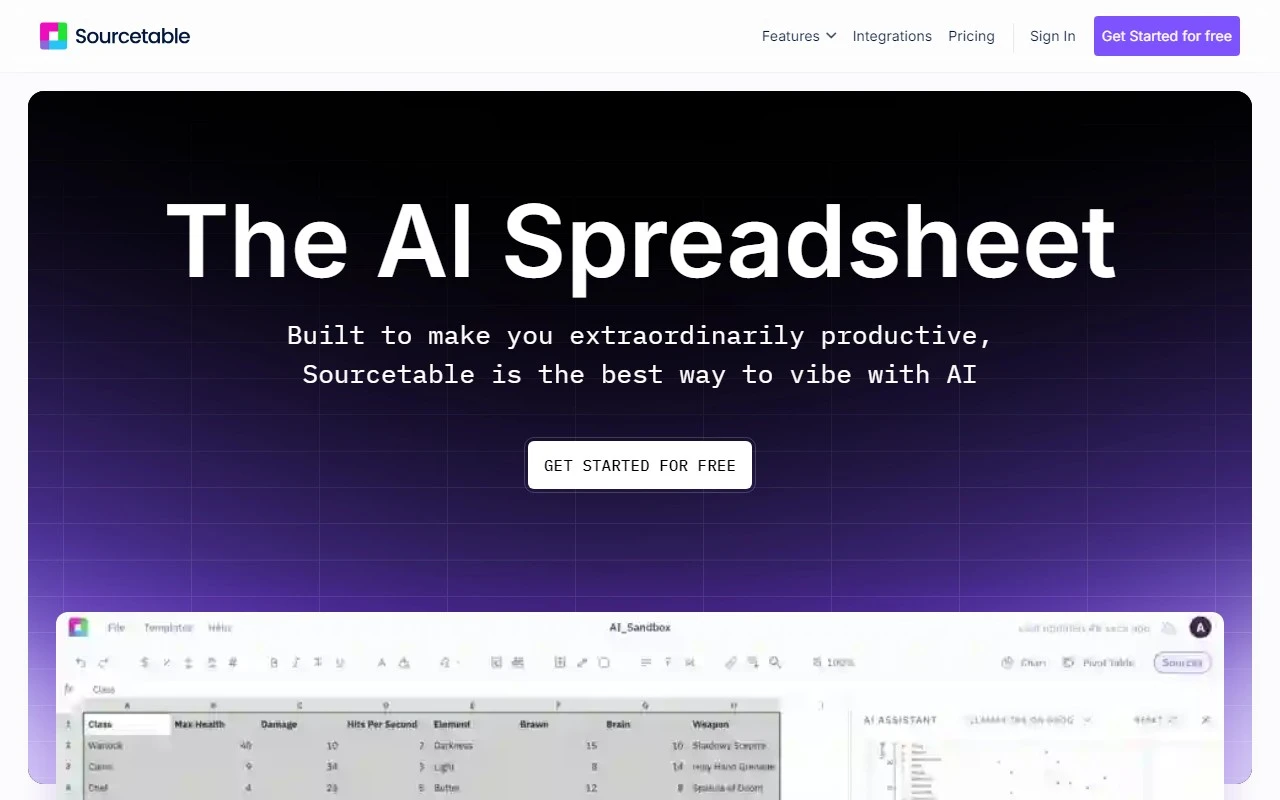
Sourcetable — AI Spreadsheet & Data Analyst: A Game-Changer for Data-Driven Workflows
If you’ve ever felt overwhelmed by spreadsheets or wished for a smarter way to analyze data, Sourcetable might just be the solution you’ve been waiting for. This AI-powered platform combines the simplicity of traditional spreadsheets with the power of advanced AI, making it a must-have tool for anyone working with data. Whether you’re a business analyst, data scientist, or just someone who loves a good pivot table, Sourcetable is designed to make your life easier.
What is Sourcetable?
At its core, Sourcetable is an AI-driven spreadsheet and data platform that simplifies complex tasks like data analysis, visualization, and reporting. Think of it as Excel or Google Sheets on steroids. It integrates seamlessly with over 100 databases and applications, allowing you to centralize and analyze data from multiple sources in real-time.
Key features include:
- AI Spreadsheet: A familiar interface with all the standard formulas and functions you know and love, plus AI enhancements.
- AI Analyst: Automates workflows and uncovers insights to support data-driven strategies.
- AI Chart Generator: Instantly creates professional-looking charts and graphs.
- AI Formula Assistant: Helps you write and debug formulas with ease.
- AI Data Cleaning: Cleans and enriches your data for more accurate analysis.
- Text-to-SQL: Translates plain text into SQL queries, making database interactions a breeze.
How Does It Work?
Using Sourcetable is as intuitive as working with any spreadsheet software, but with added AI superpowers. For a quick overview, check out their How to Use Sourcetable video. Here’s a glimpse of what you can do:
- Analyze Data: Upload your XLSX or CSV files, and let the AI handle the heavy lifting. It can clean, enrich, and analyze your data in seconds.
- Create Visualizations: Use the AI Chart Generator to turn raw data into stunning charts and graphs. Perfect for presentations or dashboards.
- Automate Workflows: Set up automated workflows to save time on repetitive tasks. For example, automatically generate reports or update dashboards with fresh data.
- Collaborate: Share your work with team members and collaborate in real-time, just like you would with Google Sheets.
Real-World Use Cases
Sourcetable isn’t just a fancy tool—it’s a practical solution for a wide range of scenarios. Here are a few examples:
- Business Intelligence: Centralize data from multiple sources (e.g., CRM, ERP, and marketing platforms) to create comprehensive reports and dashboards.
- Financial Management: Track expenses, forecast budgets, and analyze financial trends with ease.
- Project Management: Monitor project progress, allocate resources, and generate status reports automatically.
- Data Science: Clean and prepare data for machine learning models or conduct exploratory data analysis.
- Operations: Streamline workflows, track KPIs, and optimize processes with real-time insights.
Pricing and Support
Sourcetable offers flexible pricing plans to suit different needs. For detailed pricing information, visit their Pricing Page. If you ever run into issues or have questions, their support team is just an email away. You can reach them at [email protected]. For refunds or other inquiries, check out their Contact Us page.
Why Choose Sourcetable?
What sets Sourcetable apart is its ability to combine the familiarity of spreadsheets with the power of AI. It’s not just a tool—it’s a productivity partner that helps you focus on what really matters: making data-driven decisions. Whether you’re a seasoned data professional or a spreadsheet novice, Sourcetable is designed to grow with you.
Ready to give it a try? Sign up here and see how Sourcetable can transform the way you work with data. Already have an account? Log in here to get started.
For more information about the company, visit their About Us page. Happy analyzing!
