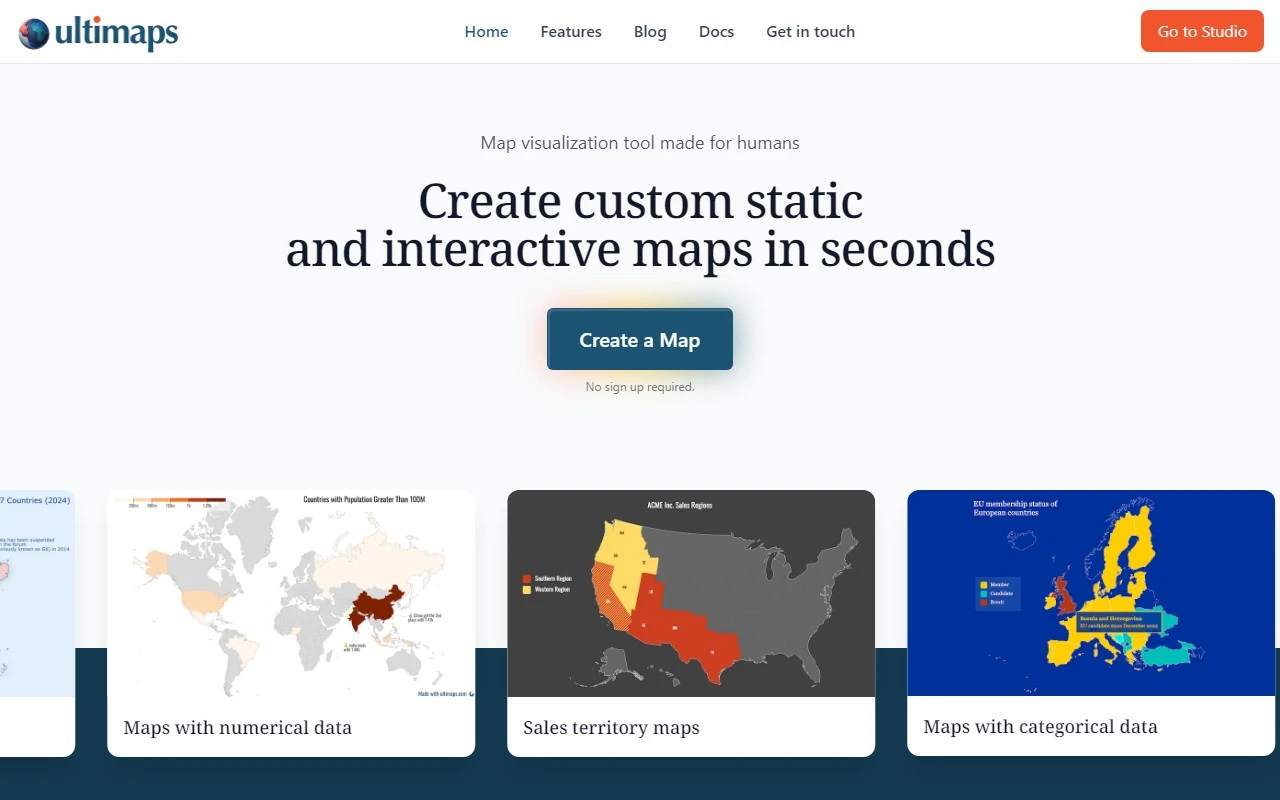
Ultimaps: Your AI-Powered Map Creation Tool
If you’ve ever struggled to create visually stunning, color-coded maps for presentations, infographics, or data analysis, Ultimaps is here to revolutionize your workflow. This intuitive online app combines the power of AI with user-friendly features to help you craft professional maps in seconds—no design expertise required.
What is Ultimaps?
Ultimaps is a cutting-edge tool that transforms your data into vibrant, interactive maps with just a few clicks. Whether you’re working with Excel files, Google Spreadsheets, or even Notion, Ultimaps makes it effortless to visualize your information. But here’s the game-changer: its AI-powered prompt system lets you create maps by simply typing instructions. For example, you could say, “I want a map of Europe with France, Spain, and Italy colored red, Nordic countries in blue, and the rest in white.” In moments, Ultimaps delivers exactly what you need.
Key Features That Set Ultimaps Apart
- AI-Driven Map Creation: Describe your vision in plain English, and Ultimaps’ AI handles the rest. It’s like having a personal cartographer at your fingertips.
- Data Import: Seamlessly pull data from Excel, Google Sheets, or Notion to create maps that reflect your exact specifications.
- Customization: Add drawings, tweak colors, and adjust fonts to match your branding or project theme.
- Interactive Elements: Elevate your maps with tooltips, popup windows, and other interactive features to provide additional context or insights.
- Shareability: Export your maps in printable formats, share them via a link, or embed them directly into your website.
How to Use Ultimaps: A Quick Walkthrough
Using Ultimaps is as simple as 1-2-3. Here’s how it works:
- Open Ultimaps Studio and select your base map (e.g., a map of the United States).
- Choose the “Use AI” option and type your instructions. For instance: “Color Oklahoma, Texas, Arkansas, and Louisiana pink; California and Arizona orange; Michigan, Ohio, and Minnesota yellow. Make all other states white and set the background to #CCCCDD.”
- Watch as Ultimaps instantly generates your map, ready for customization or sharing.
Real-World Use Cases
Ultimaps isn’t just a tool—it’s a solution for a variety of professional and creative needs:
- Presentations: Make your slides stand out with dynamic, color-coded maps.
- Infographics: Visualize complex data in an engaging, easy-to-understand format.
- Mapping Projects: Create detailed maps for research, planning, or storytelling.
- Data Analytics: Turn raw data into actionable insights with clear, interactive visualizations.
- Sales Territory Maps: Define and visualize sales regions with precision and clarity.
Support and Contact Information
Need help or have questions? Ultimaps’ support team is here to assist.
- Email: Reach out via the Contact Us page.
- Customer Service: Get in touch for general inquiries or troubleshooting.
- Refunds: For refund-related questions, visit the same Contact Us page.
About Ultimaps
Curious about the team behind this innovative tool? Learn more about Ultimaps’ mission and vision on the About Us page.
Why Choose Ultimaps?
Ultimaps isn’t just another mapping tool—it’s a game-changer for anyone who needs to create professional, interactive maps quickly and effortlessly. With its AI-powered features, seamless data integration, and robust customization options, Ultimaps is the ultimate solution for professionals, educators, and creatives alike.
Ready to transform your data into stunning visualizations? Give Ultimaps a try today and experience the future of map-making.
